THIS IS NOT STRAVA'S SUFFER SCORE CALCULATION. This is my own way of measuring the intensity of various workouts and does not show you how to calculate Suffer Score. If you want to calculate suffer score see this article: http://djconnel.blogspot.com/2011/08/strava-suffer-score-decoded.html
I cannot remember where I stumbled on the article or the information, but somehow I came in contact with the Strava App's Suffer Score. I have never really used Strava to track my runs but was familiar with the application as a bike tracking application, especially since reading this article a while back.
Being a fan of numbers and such, the Suffer Score intrigued me. The Suffer Score is an attempt by Strava to rate the intensity of a workout using your heart rate during the workout. I love the name of the metric and the idea behind rating each of my workouts. I have been tracking a metric I call ITZ, short for In the Zone, for my workouts for a while. The ITZ is a measure of how much time you spend in the target heart rate zone. I set the ITZ measure as 102 bpm which within the target heart rate zone for my age group: http://www.heart.org/HEARTORG/GettingHealthy/PhysicalActivity/Target-Heart-Rates_UCM_434341_Article.jsp
However the ITZ was a little generic in the fact that it abstracts how hard I was working out. The Suffer Score adds some detail to the intensity of the workout. I found this article about how the Suffer Score was calculated, and I started tweaking the numbers and zones.
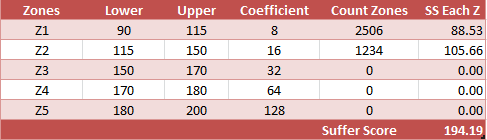
Here are the zones I came up with along with the coefficients for each zone.

To calculate the intensity of the workout I used the following formula as detailed in the calculation article above.
My heart rate monitor polls every second. So if the Heart Rate measured is in the Z1 range (between 90 and 115) then we take 8 divided by that Heart Range. Example 8/110 = 0.073
We sum up all those values and come up with a the intensity. Below is the calculation for one of my 5K runs


I cannot remember where I stumbled on the article or the information, but somehow I came in contact with the Strava App's Suffer Score. I have never really used Strava to track my runs but was familiar with the application as a bike tracking application, especially since reading this article a while back.
Being a fan of numbers and such, the Suffer Score intrigued me. The Suffer Score is an attempt by Strava to rate the intensity of a workout using your heart rate during the workout. I love the name of the metric and the idea behind rating each of my workouts. I have been tracking a metric I call ITZ, short for In the Zone, for my workouts for a while. The ITZ is a measure of how much time you spend in the target heart rate zone. I set the ITZ measure as 102 bpm which within the target heart rate zone for my age group: http://www.heart.org/HEARTORG/GettingHealthy/PhysicalActivity/Target-Heart-Rates_UCM_434341_Article.jsp
However the ITZ was a little generic in the fact that it abstracts how hard I was working out. The Suffer Score adds some detail to the intensity of the workout. I found this article about how the Suffer Score was calculated, and I started tweaking the numbers and zones.
Here are the zones I came up with along with the coefficients for each zone.
To calculate the intensity of the workout I used the following formula as detailed in the calculation article above.
S = (8/Z1_HR) + (16/Z2_HR) + (32/Z3_HR) + (64/Z4_HR) + (128/Z5_HR)
My heart rate monitor polls every second. So if the Heart Rate measured is in the Z1 range (between 90 and 115) then we take 8 divided by that Heart Range. Example 8/110 = 0.073
We sum up all those values and come up with a the intensity. Below is the calculation for one of my 5K runs
The chart shows the amount of seconds spent in each zone (Count Zones) and the score for Each Zone. The Overall Intensity is calculated as 390.09. This 5K was a the Carter Street 5K course and was ranked 6th on my list of exercises logged based on average heart rate during activity.
Here is another run. This is a 2 miler shorter run to a friend's house.
As you can see the overall intensity is lower for this run. Interesting to compare the time spent in each zone. Z3 was higher for this run and Z5 was not even obtained. Longer runs will naturally score higher on the score, however with the Z break downs you can compare the intensity of the workout with more granularity.
And finally here is a chart showing my heart rate while mowing my lawn.
The score here is 194.19. Again the nice thing about the calculation is it offers a more granular view than the ITZ (In the Zone) metric I was using before. If you are looking at the ITZ for the mowing session you would see that you spend 89% of the time in the target heart rate zone. The score shows that the workout was not that intense.


