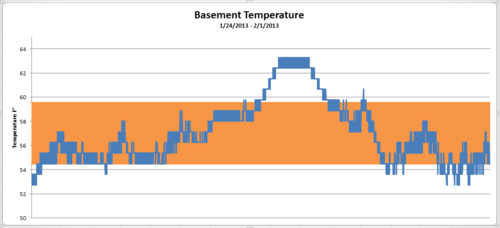
Looks like we had a spike starting on 1/28 @ 12:13PM and lasting to 1/29 @ 9:02PM. We had unseasonably warm temperatures on Monday 1/28 so I bet that would explain the spike.
Today is the coldest day in 2 years so I’ll be interested to see how far the temp dips today.


0 comments:
Post a Comment