Friday, May 31, 2013

Chiefs 2012 Review - First Down Play Calling

Last year was a tough year to be a Chiefs fan. Cautiously optimistic and hoping for the best this year. Here are some numbers from the 2012 debacle.


First Down Play calling


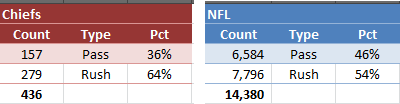
The cheifs had a total of 436 First Downs, 22nd in the league. That stat doesn’t mean a whole lot. Two possible explanations for first down counts are You stink, or you have a lot of big plays on offense. The Chiefs called a pass play 36% of the time on First Down compared to 64% rush play calls. League average pass play call on first down is 46% vs 54% for rushing play calls.


Here is the pass vs rush play calls on first down by quarter for the Chiefs and the entire NFL


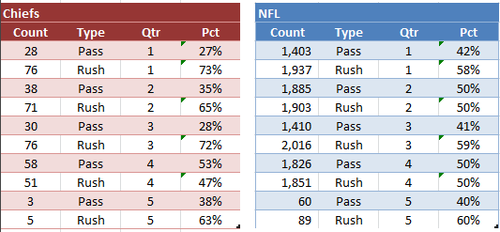
1st quarter shows heavy run for the Chiefs. Trying to establish the run early at 73% of the plays run plays. Well above the 58% league percentage. The rush play call on 1st down is lopsided in every quarter for the Chiefs except the 4th quarter. At this point in the game the Chiefs have to start passing since they were typically losing.


The sample size is too small to predict the play on 1st down, but it will be interesting to see 2013 stats with a new quarterback and new head coach.


Wednesday, May 29, 2013

Chats with Byrne

Few months back I did a word cloud analysis on IM conversations with the one and only Byrne. Word Clouds are amazingly easy using R and R-Studio. 


R: http://www.r-project.org/
R-Studio: http://www.rstudio.com/


Below is the cloud.Some notes


  • The numbers are time stamps

  • Byrne and are are in-decisive with words like probably, maybe, pretty, etc.

  • We overuse the word cool

  • Lunch is an important topic.

Friday, May 17, 2013

When is the best chance to see a HR

Between 1952 and 2012 when is the best chance to see a HR? It happens to be on a 0-0 count in the 4th inning. Historically, 53.07% of all HR balls happen on an 0-0 count.


That number, to me, is surprisingly high. 


image


The 4th inning holds a slight edge on most HRs in an inning with 12.623% of all HRs. In my opinion a couple explanations could be the pitcher is getting tired as the game progresses and/or the batter is having  more success in second/third at bats against the pitcher. Again the margin is slight. Interesting note is that the 9th inning is relatively low related to the other innings at 7.89%. Perhaps explained by the dominance of closing pitchers. However when a closer gives up a jack we seem to remember it since typically the situations are high leverage situations with the game on the line.


image


The inning with the least chance to see a HR is the 25th inning with a .0005% chance. Of course if you make it to the 25th inning to see a HR you should get some kind of prize like a free ticket to a game or a free dozen donuts or something.


Looking at 3 recent HR sluggers you can see their success on the 0-0 count. The 0-2 count is incredible. Pitchers have the upper hand on 0-2 as far as the long ball is concerned.


Perhaps the batter switches plate approach to contact, but truly an amazing drop off in HR balls on 0-2. The HR numbers fall dramatically at 0-2 count. Of course 3-0 count is the lowest HR % count since typically you take that pitch.


image