Tuesday, November 19, 2013

Heart Rate on Antioch Run

Data collection has commenced with the new Zephyr Hxm Bluetooth Heart Monitor. I have been collecting data now for a few weeks and have developed a database and website to display the data.

The website is using the JavaScript charting library from http://www.canvasjs.com. Example below.


The above graph charts out one of my lunch runs. I use RunKeeper to track my runs. The picture below shows the details from Run Keeper.


Wednesday, November 6, 2013

Moved Blog to Blogger.com

Finally got tired of the image resize drama at Tumblr and migrated to the Blogger site. I am already deep into Google with gmail, my phone, drive, etc, might as well add some more data for them to collect on me.

So all my awesome google search results are hosed since the links to my blog changed. Oh well. Sorry if that caused you some grief.


Walking through Costco

Wore the Heart Monitor while walking through Costco the other day. 
I created a database to capture all the various events I record using the heart monitor. Then I configured SSRS to display the data. I need to figure out a way to match the heart rate up with various notes. Like when walking in the frozen food section near the ice cream, does my heart rate spike up.

Friday, October 25, 2013

Heart Rate Monitor - First data

I was as excited as a tweenage girl getting her hands on the latest Fall Out Boy CD yesterday when my heart rate monitor arrived in the mail. In about 30 seconds I had my shirt off and had the chest strap and monitor on. 1.2 minutes after that I had my first heart rate readings.

I wore the monitor during our Thursday night run. We ran a little longer course and man was it chilly. Here are the results.


The data collection is dead simple. I just threw the CSV into an excel spreadsheet. I will feed the data into a database for some more analysis but so far I am happy with the Product.

Zephyr Hxm BT - http://www.zephyranywhere.com/products/hxm-bluetooth-heart-rate-monitor/

Should be fun consuming this new data set.

Tuesday, October 22, 2013

Cold Feet

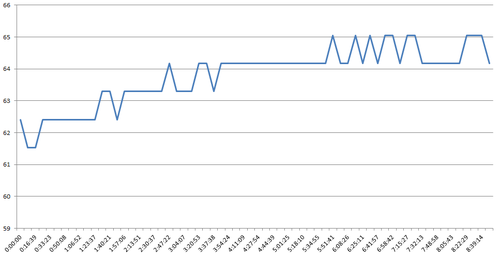
I created the Not So Mobile Temperature logger using the Arduino. Not so mobile because my 9V battery packs did not work. 


I used it to track the temperature under my desk at work. My feet are constantly cold at work in the fall/winter months. This day was a chilly day but not terribly cold.


Log Start Time: 7:36AM
Log End Time: 4:30PM

Average Temperature: 63.71
Mode: 64.17
StdDev: .085
Max: 65.93
Min: 60.65

Here is a graph using a subset of the data set.


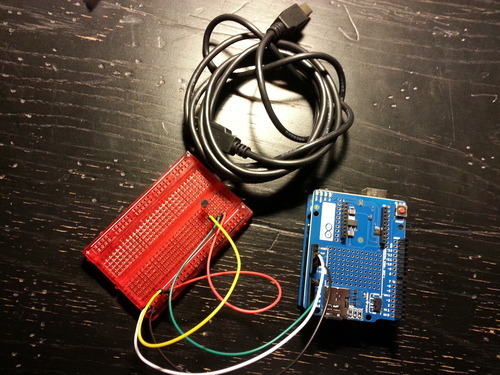
Here is a shot of the Not So Mobile Temperature Logger.


Monday, September 16, 2013

Tootsee Roll Likability Progression

Remember that awesome song Tootsee Roll by the 69 Boyz circa 1994. Well you may remember the song but not the awesomeness of it. That song has an amazing intro, and then proceeds to get terrible at about the 84.35 second mark. The song craters at this point in such a manner you are asking yourself what just happened.

Here is a non-scientific chart showing the likability progression of the song.


Click Image for larger version.

Wednesday, September 11, 2013

Multiple ALTER Trigger Statements SQL Server

I was trying to update multiple triggers in a single job step. The solution took me a while to come up with so I thought I would throw it in here. When running mulitple dynamic ALTER TRIGGER statements you quickly discover that you lose context. By using the sp_executesql stored procedure and specifying the database name you can preserv context during each execution.


Friday, August 30, 2013

Draft this Weekend

So my Fantasy Football draft is this weekend. I have taken part in a few mock drafts and keep coming up with the same issue. After the first couple of rounds you are siting there staring at the screen wondering what player to take.


Fortunately there is not a lack of analisys. Seems like everyone has an opinion, a ranking, a projected stat calculation, etc. However flipping from site to site becomes pretty tedious.


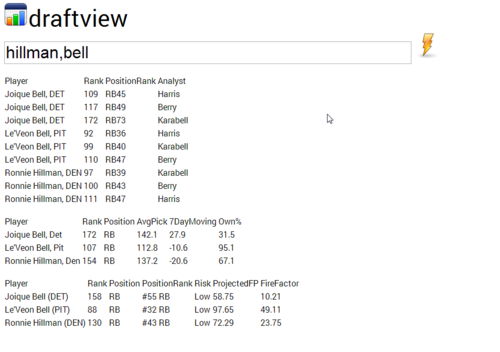
I am in a hurry now to throw together a tool I call draft view. I am scraping the web sites for analysis and throwing them into a database. From there I can type in a player or a list of players and get all the information on a single screen.


I am not predicting a victory for my team, but at least I will not be scurrying around as much during the draft trying to figure out if I should take Hillman or Joique Bell.


Early Screen shot of the app:


image


Update 8/30 @ 3:55PM


Sources of info


  • ESPN Average Draft Position Chart

  • Cheat Sheet from this one site (wink)

  • ESPN FF Projected Rankings

  • ESPN Point Projections

  • Point Projections from this one site (wink)

Wednesday, August 28, 2013

First FitBit Numbers

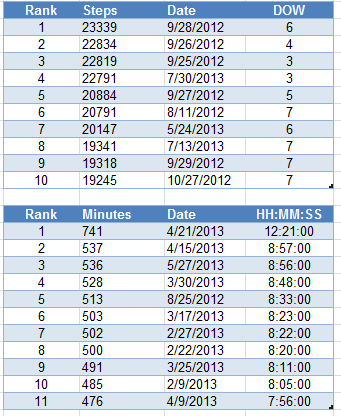
So I have been wearing the FitBit for over a year now. I thought I would start looking at the numbers. I haven’t made time to really look at the numbers but I did come up with the Top 10 Step Count days and the Top 11 best days of sleep. I used 11 because I found out that one day I forgot to stop the counter when I woke up. FitBit thought I slept for 12 hours that day…yeah right!


Thursday, August 8, 2013

PowherShell Mass download with Credential

I needed a PowerShell script to download several images from my web server. The images were in a password protected area of my web site. At first I was receiving 401 errors due to lack of authentication. So I just had to add the Get-Credential module under the System.Net.WebClient. This prompted me for a password and boom the download worked as planned.


The $i is used to denote the number in the loop. As you can see my pictures had an interesting naming format since I just exported these out of picasa as JPG. The pics were originally shot as RAW files from my Nikon


$storageDir = "C:dl"
$webclient = New-Object System.Net.WebClient
$webclient.Credentials =Get-Credential
$i = 6900
do {
$url = "http://your your.com/dsc_$i.nef.jpg"
$file = "$storageDir$i.jpg"
$webclient.DownloadFile($url,$file)
$i++
}
while ($i -le 7548)