Tuesday, January 27, 2015

Consume CSV with Python

From time to time I will find a CSV out there on the web ready for consumption (Lucky). Using Python you can easily consume the data with a few lines of code and then do your thing.

Python Download


So using python and the URLLIB2 module you can hit the CSV, convert it to a string, and then output it out to whatever CSV file you want. This will allow you to massage the data before moving on using Python. Handy if you need to remove feilds, convert data, etc.

I connect to a database using the pyodbc module and then execute the stored procedure detailed below.


SQL Data Load


Once we have the CSV file downloaded we can use BULK INSERT to throw the data into a SQL Server database for us. Sometimes you get real lucky and you can just do a straight insert into the database. As you work with more and more data you realize that is usually not the case.

The procedure below includes a quick and dirty column conversion on the location column. The data source decided to wrap quotes around the location column only. Since it was at the end of the file and I did not need the last column, a REPLACE was used and a cludgy hack was born to combine the last two columns. This works for this data load, but you may not be so fortunate and other manipulations may need done to your data.


Why?


You may be asking, "Why not just go to the USGS web site to view this data. The map is already made, searchable, etc." That is a really great question, and for most people that is the way to go. Just use the site. However grabbing the data allows you to do other fun stuff that you cannot do through the web site.

Combine this data with the previously blogged about GPS distance calculations using SQL Server and you can build a script to Tweet when an earthquake happens within a 250 mile radius of some given point. Stuff like that.

Tuesday, January 20, 2015

NBA Log5 and Expected Wins with Python

With the NFL down to its final game, I needed a new sport to start projecting the games using Log5 and Pythagorean wins. Next up, NBA. One cool thing about the NBA is the sheer volume of games. The projection calculations can get a good workout selecting daily winners.

I started piecing together the scripts and infrastructure needed to project the daily outcomes using Python. The projections are calculated like my NFL POW using both Neutral Court and Home Court Advantages. I am using 60.5% as the Home Court Advantage factor.

Examples


Let's take a few match ups on 1/19/2015


  • All projections have the Hawks winning easy 
    • Log5 - 90.82% chance of home team winning
    • Pythagorean - 83.18% chance of home team winning
  • Log5 is based solely off Win/Loss record explaining the high projection
  • The Pythagorean projection had the teams matched up a little closer.


  • The Log5 projection on this game had the Bulls winning, whereas the Pythagorean projection correctly projected the Cavs would win. 
  • Both projections were near 50% indicating the game should have been close and should have been a good game.
  • Cavs out performed expectations and blew the bulls out by 14.
  • Here is an example where both projections got it wrong. 
  • Both projections are close to 50% so its not a huge disappointment here. Sometimes things just happen.
  • Even the Knicks have to win some games.
  • Pelicans were huge favorites in both projections here
  • The Knicks pull off a stunning victory.

Overall Record


I turned the projection system on for the 1/14/2015 games. Here is the current overall record.
  • Log5 Record: 33 - 16 (0.67)
  • Pythagorean Wins Record: 32 - 17 (0.65)
We'll see how well the projections perform over the next few weeks. I plan to setup something for baseball too.

Tonight's match up


The projection methods do not agree on the winner of the Heat/Thunder game this evening. We'll see which one is correct.


Monday, January 12, 2015

NFL Picks of the Week Final results

As I blogged earlier I wrote a series of scripts to grab NFL game results data, points for/against, and the various records of NFL teams in an attempt to predict the winners of the weekly NFL matchups. This was a straight head to head pickem (no spread picks) to determine the winner of the matchup. The projections were handled using Log5 and the Pythagorean Wins Expectations calculations.

The projections were started week 11. So how did I do?

Results


Overall Record: 73-35
Win Pct: 67.5%


WeekRecord
118 - 6
1213 - 2
1310 - 6
1411 - 5
1512 - 4
168 - 8
1712 - 4

Week 11 and Week 16 were the worst, however I did not have a single losing week. What teams were the most difficult to project?

TeamLog 5 Wrong
Arizona Cardinals4
Philadelphia Eagles4
San Francisco 49ers3
Cleveland Browns3


TeamsPyth Wrong
Philadelphia Eagles4
Cleveland Browns3
New Orleans Saints3

I used the Pythagorean Wins Expectations calculations for my actual matchup picks. If I used Log 5 to project the winners I would have missed 3 more picks on the year. Therefore the Log 5 win percentage was 64.2%.

The Eagles


The Philadelphia Eagles caused the projections the most grief showing up on both the Log 5 and Pyth top Wrong list. What does that mean? It basically means the Eagles lost about 4 games they should not have lost. However if we look closer only 2 of those games really stand out as terrible.

The week 16 debacle against the Redskins is Exhibit A in the Eagles bad second half of the season. According to the Pythagorean Projection the Redskins had a 26.91% chance of winning that game.


The week 11 showdown with the Packers was absolutely ugly with a final score of 53-20. The Packers were given a slight edge in the projection 54.85%. So the game should have been a lot closer than the score.

The Cowboys loss in week 15 was a lot closer. Pythagorean projection stated the Eagles had a 62.95% chance of winning the game and the Cowboys pulled ahead late in the game. Same story with the Week 14 Seahawks game. The projection had the Eagles with a 55.87% chance to win against Seattle.

All of these teams are playoff teams. Looking at the Eagles entire schedule you see one loss from a non-playoff team and that is the Week 4 loss at San Francisco by less than one score.

The Eagles did not make the playoffs, but if you throw out the Redskins game, they had a great season considering their opponents and outcomes.


Future Plans


I have a few things to work on for next year. I need to solve some current week logic. I had some issues with the system recognizing the current NFL week. I may create a week table so it will just pick from a list.

Also I would like to automate it from end to end. I have been executing the scripts and such manually to make sure everything was working.

Friday, January 9, 2015

Python TextBlob Sentiment Analysis

I am taking Python TextBlob for a spin. TextBlob is a python library for processing natural language. Modules like this are what makes Python so fun and awesome. This module does a lot of heavy lifting. First impressions are pretty good.

So what does it do. I am using the Sentiment Analysis portion of the module. Sentiment Analysis refers to the process of taking natural language to identify and extract subjective information. You can take text, run it through the TextBlob and the program will spit out if the text is positive, neutral, or negative by analyzing the language used in the text.

Why is this cool? By hooking this up to Twitter you can get a the pulse of how people feel about something. Feed in some text from an email you received and you can measure the tone of the email to see if the message is positive, neutral or negative. If that is not cool enough for you than that is a you problem.

Take that statement for example: "If that is not cool enough for you than that is a you problem."

I ran that through a Sentiment Analysis and here are the results.


Sentiment Analysis
TextIf that is not cool enough for you than that is a you problem.
Polarity-0.0875
Subjectivity0.575
Classificationneg
P_Pos0.344455873
P_Neg0.655544127

What does that mean?

  • Polarity - a measure of the negativity, the neutralness, or the positivity of the text
  • Subjectivity - value from 0 to 1 measuring the subjectivness of the text. 0 is objective, 1 is subjective
  • Classification - either pos or neg indicating if the text is positive or negative
  • P_Pos - a measure of how positive the text is
  • P_Neg - a measure of how negative the text is

Pretty cool if you ask me. I started playing with the text to see if I can shift the values. Check out this test on various sentences about hummus.


Text polaritysubjectivityclassificationp_posp_neg
Humus is good0.70.6pos0.5042265430.495773457
Hummus is good. Hummus is terrible.-0.150.8neg0.2347306510.765269349
Hummus is great. Hummus is terrible.-0.10.875neg0.3022460180.697753982
Hummus is awesome. Hummus is terrible.01neg0.4327330510.567266949
Hummus is amazingly awesome. Hummus is terrible.01pos0.584239130.41576087

Terrible is a pretty negative word. It is a lot stronger than the word good. Notice in row 2 good did not overcome the word terrible. Great could not overcome the world terrible. Awesome moved the needle to positive a bit more but still could not cancel terrible. Amazingly Awesome finally shifted the statement to the positive classification.

I then started hooking this up to Twitter. Since I already knew how to Authenticate to Twitter using Python, all I had to do is figure out the search functions to search for various topics. Here is some sample code.

So we are importing our modules needed to do the TextBlob analysis. We take in some arguments that we use as twitter search terms. I have hard coded the tweet count to 250. We loop through the list of arguments and execute a twitter search for each term. Then send the resulting tweets through the TextBlog sentiment analysis. I take the sentiment results and stuff them into a database.

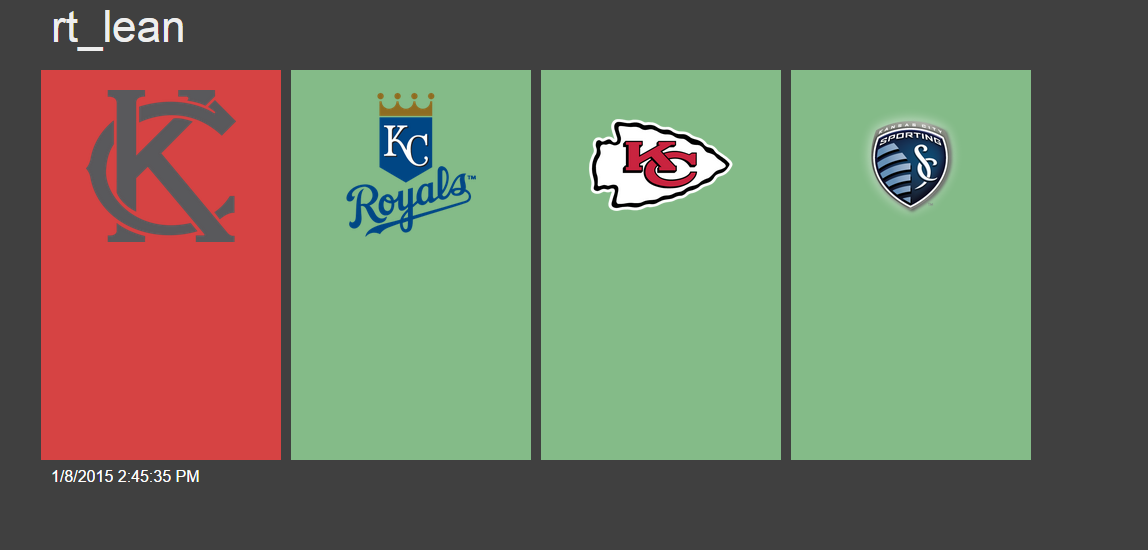
From there I made a quick web site to display the current sentiment of some search terms. Green background means a positive sentiment and red means a negative sentiment. Here is a sample of Kansas City, KC Royals, KC Chiefs, and Sporting Kansas City.


This is just version 1. I plan to color the background based on the Polarity. That will offer a more granular representation of the overall feel of a topic. I plan to also add the numbers to the site so you can see the measure of polarity and such. Trending is in the works, since I am storing the sentiment values on each run of the script. I can display a trend on how the search term is changing over time.

I call the sentiment site RT_Lean which stands for Real Time Lean, which means how are people leaning on a search term in real time.

Monday, January 5, 2015

2015: The year of the Homemade Hummus

As we ring in another year we here at thejoestory tech embark on a new culinary quest. The Homemade Hummus Quest challenge of 2015. Each month we will try a new recipe in an effort to find the best tasting, easy prep cost effective homemade hummus. Each recipe will contain a grand total of 5 ingredients.

Of course what would be a new thejoestory tech quest without a website to go with it?

http://www.thejoestory.com/food/hummus/


Here you will find each recipe, pictures, date prepared and an overall rating of each hummus recipe. 

Pesto

This month we tried Pesto Hummus. Again we are working to keep cost low, prep easy, and taste high. I used a pesto pouch from the seasoning aisle and some of the finest Always Save Grated Aged Parmesan cheese. Of course we could step up our game on the quality of ingredients and I am sure the outcome would be better. However one of the goals of the Hummus Quest 2015 is to keep costs down and preparation as easy as possible.


Making Sweet Tea

Here at thejoestory tech we like sweet tea...a lot. I couldn't think of a better way to take our new digital kitchen scale for a test spin.

Ingredients

  • 5 bags (.46 oz) of your favorite black tea. I used Lipton
  • 2 cups hot water
  • 1/2 cup sugar
  • 20 to 25 ice cubes
  • 5 cups cold water
  • Beverage to mouth delivery vehicle (some sort of cup)

Instructions
  1. Heat two cups of water in a microwave safe measuring cup for 2 minutes and 45 seconds.
  2. While waiting for water to heat un-package the tea and tie a fancy knot (optional) to ease bag removal.
  3. Pour 1/2 sugar into your pitcher
  4. Pour the hot water from the microwave into your pitcher containing your sugar. Mix until all sugar is dissolved.
  5. Add the tea to the sugar water
  6. Set a timer for 5 minutes and let the tea swim in the sugar water
  7. Remove the bags from the sugar water, stir the tea
  8. Add 20-25 ice cubes to the tea and stir
  9. Add 5 cups of cold water to the tea
  10. Add some ice cubes to your beverage to mouth delivery vehicle, pour you a nice tall glass of sweet tea, and enjoy.

Notes: If anyone tries to make you add sugar to already prepared cold unsweetened tea, try not to hold this against them. Show them the proper way to make sweet tea.