Friday, October 31, 2014

Candy Tracker: Finding the Sweet Spots

So here is how the conversation went.
J: "team story going trick-or-treating tomorrow?" 
Me: "Roger that. We hit the liberty square hard. candy like you've never seen and then we hit grandma's street. boys don't have the stamina yet to hit the epic haul. you have a small window where you have the strength and you are not too old...like the 9-11 range" 
J: "lol im surprised you haven't mapped out the hot spots" 
Me: "thats a good idea i could build a mobile app real quick and then just rank the candy, then heat map it" 
J: "hahaha. there ya go"
Thirty minutes later the first version of Candy Tracker was up and rolling. I am using jscript to find your current GPS coordinates and using the Foundation Framework to make it look decent on mobile.

The idea is that as you walk around tricker-treating with the kids you log what candy you get and give it a simple rating. Of course the ratings will be subjective and could possibly cause fighting when discussing the best candy.

Since we have the GPS coordinates and the candy rating why not show this on a map? Version 2 of the Candy Tracker included the SweetSpot (thanks for the name PV) Real Time tracking map. I put a marker on a map and color the marker based on the rating given to the candy.


  • Green marker: Candy Rating > 7 Swoop Swoop 
  • Yellow Marker: Candy Rating Between 4 and 7 
  • Red Marker: Candy Rating less than 3, Dont't waste your time they are handing out pretzles or something.

Here is the current version. Feel free to test spin it out tonight while you are out and about. http://www.thejoestory.com/candytracker


Thursday, October 30, 2014

Twitter Status Update Python Script

Posting a status update on Twitter is very simple using Python. Here are the steps.

Youtube Demo:


  • Setup a new application for your account on http://apps.twitter.com
    • You will want to setup a read/write application
    • Give it a name and a URL
    • Twitter will give you 4 pieces of info you need
      • Consumer Key
      • Consumer Secret
      • Access Token
      • Access Token Secret
    • You can find all these tokens and secrets under the Keys and Access Tokens Tab on twitter.
  • Install the Python Twitter library using easy_setup
    • Head to a command prompt and run: easy_install.exe twitter
    • If you do no have Easy Install setup then google that and get it setup today. It makes adding modules to Python a cinch.
  • Write the script
    • Using your secret tokens and keys and your newly installed twitter module. Write a script like this. 

Tuesday, October 28, 2014

MLB Expected Outcomes

Stumbled on this article 10/23 about predicting MLB AB Outcomes and thought to my self "Self! that would make a decent web app". I wanted a quick way to compare batters and pitchers while watching the world series.

The article had a spreadsheet that allowed you to plug in numbers to the cells to get expected outcomes. Since he had the data already available why not make it where you can plug in various batter pitcher combos to see what happens.

I quickly realized this spreadsheet had some more math than I thought, but I was able to get something hammered out as a version 1 type site that did a decent job with the comparing. One glaring issue is the fact you have to search through the mega drop down box to find the players. I plan to change that in version 2 to create an auto suggest type feature...that is if I get around to it.

For now you can see the version 1 here: http://www.thejoestory.com/mlb_eo


Tuesday, October 21, 2014

NOAA Weather Data

Yeah so I'm a little weird. I get excited when someone says "Do you have access to X data set?" "Can you find data about X?" and other sorts of questions about data. When I see a new data set I have this overwhelming urge to put the data in a database and start running queries. You can shake your head here.

So yesterday when a friend asked me "How much weather data do you have access to?" I was excited. Excited enough to eat lunch at my desk and pound out a weather data load and weather search website.

I started searching for weather data and quickly landed on the NOAA web site. They have made huge strides in the past 5 years (like everyone else) to distribute data to the masses in easily consumable forms. Starting with this site: http://www.ncdc.noaa.gov/ and clicking on Data Access landed me here: http://www.ncdc.noaa.gov/data-access.

My friend wanted temperature high, low and precip amount. Using the Land-Based station section on the NOAA data access page I quickly stumbled on this: http://cdo.ncdc.noaa.gov/qclcd_ascii/

Gamechanger! CSVs. How can you not get excited about CSVs!!!!


So now all we need is a script to grab the zip file, extract the files, clean up the CSV a bit, load the data, and build a web front end to expose the data.

Python Script Extract and Load


Database

I just needed a couple tables and a few stored procedures to expose the data to the web site. <disclaimer soap box>I understand this code will not scale well. I did not want to spend a lot of time modifying the data. Remember this was on my lunch break. Most of the stuff I write is throw-away code or is only used by a handful of people. This is good because I typically do not have to worry about scale, and bad because I am not learning the  techniques of writing code that scales.</disclaimer soap box>


Web Site


Now that we have the data we can build a quick UI using the Foundation Framework. You need to know the weather conditions at Big Bear City Airport in California from 8/15/2014 to 9/21/2014, no fret I got the deets. Holding weather conditions down over here. What What.

Sorry for that last sentence. I was trying to make weather conditions sound hip to the millennial crowd.

Anyway another dataset consumed, another victory lap taken, another celebatory Mt. Dew opened. Its a great time for consumers of data to be alive.


Monday, October 20, 2014

Tail command for Windows

I have been searching for a good Tail command for windows for a while. There are some free tools out there but none really tickled my fancy until I stumbled on Log Expert today. Log Expert is a Codeplex project located here: http://logexpert.codeplex.com/

The tool allows you to browse out to a file and monitor that file for changes. Handy when you are watching a log file during a script run, monitoring your IIS logs for web traffic, or monitoring your SQL Error Log for issues. Log Expert allows you to setup highlighting rules so if you are looking for key events in the log you can easily identify them.

 I was monitoring the Windows Update process on one of our SQL Servers trying to troubleshoot what was wrong. I setup LogExpert to monitor the WindowsUpdate.log file on the server in question. I then defined a Highlighting rule to highlight all the messages in the log that contained Error or Failed. Look at this sea of red!!


So basically its just saying I cannot get to the internet on that server. Someone must have changed a setting or something. I didn't need the LogExpert to help me figure this out, but its a great tool if you miss the Tail command from Linux or if you need to monitor a log file for some reason.

Thursday, October 16, 2014

Fridge Cooling Zones

We share a dorm room fridge at work over by our cubes. Keeping those cold Mt. Dews at the ready at all times. I thought it would be interesting to see the temperatures of the various areas of the fridge. So I broke the fridge into 14 zones, grabbed a thermometer from home and set out to collect the data.

Fridge Specs
First some fridge specs. We have a Haier Model HNSE05. Here are the specs.

PropertyValue
MakeHaier
ModelHNSE05
Capacity4.6 cu ft
Amps1.5
Max Amps6
High side pressure300 psig
Low Side pressure88 psig
RefrigerantR134a,1.94Oz
Dimensions20 5/16" W x 22 1/4" D x 32 1/16" H
Net Weight66.11 pounds


Assumptions

So really this was a quest for optimally cooled Mt. Dews. The original thought was to place the Mt. Dew as close to the Freezer as possible. Here is how the fridge was broken into zones.


So it would make sense that Zone 3 would be the best place to put the Mt. Dew. If you check the fridge picture above you can see a Mt. Dew in Zone 3. The following assumptions were made.


  •  Zone 3 is the best place to put a Mt. Dew for optimal cooling.
  •  Zone 13 should be one of the warmest since its in the door and since its the farthest away from the freezer.
  •  Zone 6-9 should be warm since they are far away from the freezer


Hot Zones

I took temperature measurements over the course of a few days. I would move the thermometer into a zone and then typically let it sit for at least 2 hours. The following heat maps show the resulting temperatures.


As expected Zone 3, directly under the freezer, was the coolest non-freezer area in the fridge. Zones 6-9 were some of the warmest zones in the fridge with Zone 9 measuring the warmest spot. The door zones 10 and 11 fared pretty well since they are close to the freezer. Door zone 12 was one of the warmest zones which surprised me a little since it was warmer than zone 13. Zone 13 is closer to the freezer but registered a full 3 degrees cooler.

Mt. Dew Temps

So now that we have proved the optimal cooling zone in the fridge is Zone 3, how long does it take to cool a Mt. Dew down to the optimal drinking temperature. The optimal drinking temperature here is the coldest temperature we can reach with this fridge. I brought a Mt. Dew in from home and used the Infrared Thermometer to record the temperatures throughout the day.

Date/TimeZoneTemp
7/30/2014 7:03:00out70.3
7/20/2014 8:10:00351.6
7/30/2014 10:29:00348.6
7/30/2014 11:48:00346.5
7/30/2014 13:39:00348.5
7/30/2014 14:42:00340.2
7/30/2014 15:47:00343.4
7/31/2014 6:47:00344.3
7/31/2014 8:57:00342.1


Initial temperature reading was 70.3, followed by a 20 degree drop in the first hour. By hour 3 we are sitting in the 40s and we hold steady for the next 5 hours. Lowest temperature was measured at 14:42 @ 40.2 degrees. The temp increases at 15:47 and holds steady in the low 40s as apparent in measurements taken the next day in the morning.

Based on the findings I should crack open the Mt. Dew around 14:30-14:50 for optimal cooling. Further testing is in the works to confirm that this is the most optimal time to initiate Dew-30 and crack open an that ice cold sweet citrus flavored nectar of champions.


Tuesday, October 14, 2014

Torque2 Version 1: How long is your commute

"How long is your commute?" I chuckle to myself when someone asks that question. My typical response is "It depends, Morning or Evening?" From here the conversation can progress one of several ways.


  • If response = eye roll then quickly changed the subject "How is the weather?", "Did you see {insert lame popular with the masses game/reality/competition show name here} last night?
  • If response = curiosity then proceed cautiously with follow up data...Typically Wednesday PM commutes are shorter, gauging interest, quickly reverting to game/reality/competition show conversation if necessary.
  • If response = red pill/blue pill type reaction then show them the site, and maybe even live demo the system of data collection to them (this happened one time)

Anyway based on the response of the person they may or may not see the Torque2 web site. I am using this site to present data about the to and from work commutes. Questions like how long is your commute, what is the fastest speed recorded in your commutes, Average MPG, etc are all answered with some snazzy looking charts and stuff.

The site has a few moving parts and pieces
  • OBD Adapter - several out there. I have been really happy with this one: 
  • Torque App for Android - This app is well worth the $5 dollars you are going to spend. Fantastic app that reads data from the OBD adapter over Bluetooth. 
  • CSV File - The Torque app spits out a CSV file with data for every second of your commute
  • Database - The CSV file is loaded into a database in order to crunch the numbers
  • Stored Procedures - A set of stored procedures were written to crunch and expose the data
  • Web site - The Torque website was built using the Foundation Framework mobile first design. It plays decent on mobile browsers (still tweaking) and the framework just works right out of the box.

The Future

I am working on some metrics to gauge aggressive driving, such as sudden RPM increases, sudden speed decreases, etc. the create an overall aggressive driving metric. I started this a while back with Torque version 1, but would like to finish it up and create an aggressive driving metric page.

http://www.thejoestory.com/torque


Friday, October 10, 2014

KC Traffic Out Scouting the Scout

We have a video camera, roadway sensor, digital sign, traffic management system installed in Kansas City called KC Scout. The KC Scout provides realtime traffic data across the metro. The service has a web site and is pretty handy for checking in on traffic around the metro.

Using the stripped down KC Scout mobile web site I found a way to grab all the data from the speed detectors around the metro. Using this data I was able to build a custom system that would notify me if traffic on my route to and from work was delayed. Here is how it all went down.

Python Script
First I wrote a python script to scrape the mobile web site to get the speed detector data.


This script will grab all the detector data and insert it into a database. I wanted to store data over time so I can run some trending analysis at a later date. So we store speed data captured every 5 minutes. The python script is executed as part of a Scheduled Task.

SQL Table Structure
I created 3 tables to support the data collected and to display the results.


  • data - stores the speeds from the detectors
  • routes - stored the route id and the route name
  • routes_location - stored locations, sort orders, and route numbers for each location in a route


This allows me to add custom routes for the various commute options around the metro.

SQL Stored Procedure
Once I had a steady flow of data I created the following Stored Procedure to display the data.


This procedure allows me to pass a Zone ID and the number of Minutes I want to use to calculate the average speed for a specific location. I added a sort column to the kctraffic_data_routes_location table so I could put the locations in the correct order along the specified route.

Webpage
I then created a front-end to display the data. I didn't spend a lot of time on the front-end because to me the bigger value is in the email notification. I did use the Foundation Framework in attempt to make it look good on a mobile device. I tested it with my Galaxy S3 and it looks decent. I may need to tweak the size of the fonts and such to make it fit better but for now its good.


Notification System
I am still working on this. I created a scheduled task to query the locations on my route to see if any location was running slower than normal. If certain thresholds are met then i will email myself a traffic alert a few minutes before leaving from home or work. The email contains a link to the web page detailed above so you can get a quick view of the problem areas along your route and plan accordingly.

I am sure most, if not all, this functionality is available through the Scout website...but what fun is that really.

Monday, October 6, 2014

The following feature couldn't be installed .net framework 3.5

/xpost justsql.wordpress.com


I entered an almost infinite loop of installation fun on Windows Server 2012 the today. I wanted to share my adventure with others in an effort to save time and prevent you from drop-kicking your laptop like I almost did.
How it all started
  1. Started install of SQL Server 2014 on fresh Windows Server 2012 build
  2. Install reported I needed .NET 3.5 Service Pack 1 to continue
  3. Launched Server Manager
  4. Clicked Add Roles and Features
  5. Clicked through to the Features list and selected .NET Framework 3.5 and then clicked install
At this point I entered the almost infinite loop. The install failed several times. I tried going to the Microsoft website to get the install. When I launched the install I was delivered a message that you are not cool and that this won't work, go back to add features in Server Mangaer.

First Lifeline
First lifeline was found in this support article from Microsoft: http://support.microsoft.com/kb/2734782/en-us. This article has a section on troubleshooting error code 0x800F0907. I followed the steps in this article and was able to add the .NET 3.5 Feature using server manager.
The Fix
Her is how I fixed the problem.
  1. Open Group Policy Editor
  2. Browse to Computer...Administrative Templates...System
  3. Double click on the Speciy settings for optional component installation and component repair option.
  4. Click Enable and check the box next to Contact Windows update directly to download repair content instead of WSUS
  5. Click OK
  6. Launch an elevated command prompt and type in gpupdate /force to update the Group Policy
  7. Return to the Server Manager and try to add the .NET 3.5 Service Pack 1 Feature.
  8. Crack open celebratory Mt. Dew and bask in the warm glow of your dominance.

Wednesday, October 1, 2014

Perez v Molina

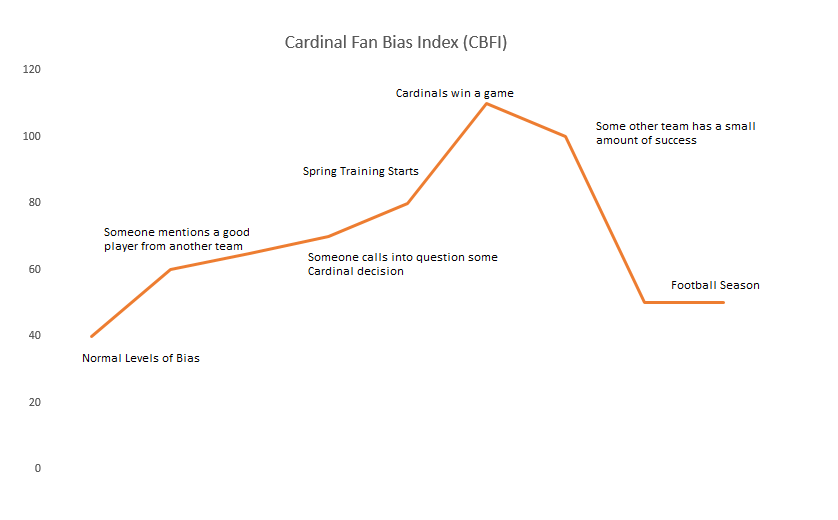
So there I was enjoying the most important win in the past 29 years of Royals baseball, and of course a Cardinals fan post shows up in my Facebook Feed about how Salvador Perez is not even in the conversation of Yadier Molina. Typical Cardinals fan, who needs to look at data and such when you have that great Cardinal Fan instinct mixed with a steady dose of Cardinals Fan Bias (see chart at the bottom of post).

This article is equal parts disdain for the Cardinals, and a comparison of Salvador Perez and Yadier Molina. I'd say that my disdain for the Cardinals is rooted in the fact that I cannot stand the town in general. Why I don't like St. Louis is part mystery, part Missouri resident requirement. If you live in Missouri you either like St. Louis or you like Kansas City. Those who say they like both are either do not live in the state or they are lying to your face (meaning they are probably from St. Louis).

Anyway to the numbers. Let's start with offense. Molina has played 11 seasons so of course he has more total Hits, doubles, etc. then Perez. We will start by comparing Molina's first four seasons to Perez's first four seasons.


  • Both players played in about the same number of games. Perez - 403, Molina - 405
  • Perez has had a better first 4 seasons at the plate compared to Molina. It is not even close really. 
  • Molina's batting has improved by leaps and bounds since his first four years. He is now one of the best hitting catchers in the league.
  • Compared to the last 4 seasons of Molina at the plate Salvador is not that far behind. Molina has had 300 more ABs that Perez over the last 4 seasons. Their BA is close with Molina at .305 and Perez at .296. 
  • Molina has 11 more HRs than Perez in the past 4 seasons, more doubles, more hits. Perez is leading in Triples. But again their BA is very similar. You would expect a ball player to become a better hitter over the years. That is just what Molina has done. However Perez is better at the plate than Molina was after his fourth season. It is on Perez to continue to improve but the talent is there.

Now lets move to Fielding.

Using standard metrics Perez matches up well to Molina's first 4 seasons. 

  • Molina edges out Perez on Total error count with 19 vs Perez's 23.
  • Standard Fielding Percentage (some say a flawed stat) is very similar Perez vs Molina's First 4 seasons. Molina has a slight edge on Fielding percentage in the last 4 seasons .9965 to . 992.
What about the Advanced Fielding Metrics, DRS, rSB, FSR, and such
  • Both catchers had DRS scores of 8 in 2014
  • Over the past 4 seasons DRS has been very similar with Molina 32 and Perez 29
  • FSR scores have been similar with Perez trending upward to match Molina's recent success. 
Currently I would give the edge to Molina since he has been more productive at the plate the past 4 years, a small edge in defensive prowess, and the experience factor. He has played more seasons and you can see how he has developed into one of the best catchers in the game.

However Salvador Perez has all the tools and the numbers to show that he has the opportunity to play just as well as Molina if not better should he continue to progress and develop his craft. Both catchers are elite Tier 1 catchers. If I had a strong team making a World Series push I would probably go Molina. If I was building a team and wanted upside and youth, I would go Salvador. To say Salvador Perez is not in the same conversation as Molina is typical Cardinal Fan Bias which we can track in the graph below.


Royals Wildcard Game Recap

Epic. Just an epic battle with an amazing outcome. A game 29 years in the making. Hopes dashed by the 7th inning. I wanted to go ahead and finish out the game to at least say I made it to the end. Man am I glad I did not turn the game off. With a 2.9% Win Expectancy heading into the 8th it was a long shot at best. The Royals kept scrapping and battling scoring 3 in the 8th. I thought at least they made it look respectable. At least they have a chance in the 9th.

Of course Holland did what Holland does and loads the bases in the Top of the 9th. He pitched his way out of a jam and we move to the Bottom of the 9th. Willingham gets a quick single to right to lead off the 9th and Dyson comes in to pinch run. Escobar lays down a bunt to advance Dyson to second. Then in one of the gutsiest calls of the night Dyson steals 3rd on an insanely close play:

Aoki steps to bat with 1 out down 6-7 bottom of the 9th and a guy on third. He hits a deep sacrafice fly to tie the game. The Leverage Index (LI) on that AB was a game-high tying 5.99. Huge hit by Aoki to send the game into extra innings. Here are the highlights of the entire crazy 9th inning.
In another gutsy move Yost decides to bring in Brandon Fennigan. Three months removed from pitching in the College World Series, Fennigan is brought in to pitch in the most important Royals game in 29 years, and the dude delivers. Fennigan is lights out in the 10th inning, Fly out, ground out, strike out. Boom Boom Boom. Hosmer gets the bottom of the 10th started good with a lead off single. Colon moves him over with a bunt (one of 4 sacrifice bunts of the night). Gordon grounds out and Hosmer moves to third. Salvador Perez walks to the plate with a chance to win it. The LI for Perez's AB is 4.57. Already having a poor night, 0-4,  at the plate (actually a poor entire month of September) Perez grounds out to second to go 0-5 on the night.

Fennigan comes back out in the 11th inning. Again this guy was in college 3 months ago. Strike out, ground out, single, strike out. Insane, start mass producing Brandon Fennigan jerseys. What a performance. Infante gets the bottom of the 11th started off with a lead off single. Dyson sacrifice bunts Omar to second. Escobar grounds out moving Omar to third. Then for some strange reason Yost pulls Aoki for Jayson Nix. Nix walks up with an LI of 4.57 and then promptly strikes out looking. The luck is running out at this point. The Royals have to finish this game soon.

And then boom, Top of the 12th inning Reddick reaches on a walk, followed by a sacrafice bunt from Lowrie to advance Reeick to second. Yost pulls Fennigan for Frasor. Frasor then throws a wild pitch and Reddick advances to third, followed by a single from former Royal Callaspo to give the A's a one run lead. At this point again I am thinking well we at least fought to the very end.

It looked pretty bleak in the bottom of the 12th as Cain grounded out to first for the first out. The Win Expectancy at this point is 10.1%. Hosmer steps to the plate and crushes a ball to left field. It is a foot from being a game tying Home Run.


Hosmer is on third with a stand up triple off the top of the wall. Incredible. Christian Colon walks up to the plate with an LI of a game-high tying 5.99. He slaps an infield single to tie the game.


 Then 0-5 Salavdor Perez walks up to the plate with a chance for redemption. Oakland calls a pitch out to try and stop Colon from stealing second, A's catch Norris does not catch it cleanly and Colon is in safe at Second. Pickoff Throw, Ball, Foul Ball, Swinging Strike, Pickoff Throw, Pitch Out (with the error), and then a Foul ball. So with the count 2-2 winning run on second, Salvador Perez slaps a single, on a pitch he shouldn't have swung at much less hit, down the left field line to drive in the winning run in the bottom of the 12th inning. 


The Perez hit just sneaks past third baseman Donaldson. What a game. One of the wildest post season games I have ever seen. Double bonus it was on my birthday. Triple bonus it was the Royals first post season appearance in 29 years. Now the Royals move on to play a tough series with the Angels. Blue October has caught fire here in Kansas City.

Here are the top 15 plays based on highest Leverage Index. Leverage Index is a measure of the amount of pressure on a play based on the game situation. You can read more about it here: FanGraphs LI Definition


The Average Total LI for Royals game this season is 77.51. Last night's game had a season high Total LI of 195.5. What an exciting game. Go check out the FanGraphs Box score page for an in-depth view of the stats of the game, including this Win Probability Chart