Monday, December 22, 2014

Yahoo Fantasy Football API Using Python

UPDATE: the YQL module can no longer be installed directly using PIP. You have to install it from pip using the GitHub repository. Check out this Stack Overflow post on how to get er done: http://stackoverflow.com/questions/15268953/how-to-install-python-package-from-github


Game Changer...after about 8 hours of trying to figure out how to use Yahoo's Fantasy Football API I finally made some huge progress. I was able to use Yahoo's 3-legged OAuth method to authenticate to my Yahoo Fantasy Football league. From there it was just a matter of figuring out how to traverse the various JSON responses in order to consume the data.

This post assumes the following:

  • You have Python 2.7 installed
  • You know how to add modules to Python using easy_install or pip
  • You have some general knowledge of moving around in Python
Holler if you have any problems or if you have a specific question.


Authentication and Sample Scripts


OAuth Steps

I had to setup a few things before getting started. I am hitting the yahoo API using YQL which is Yahoo's Query Language. You can try out the YQL Console here. I used the console often to test various queries. There are several samples of queries hitting various APIs.

YQL Module Oauth Update 12/1/2015

The YQL Python module I was using is no longer maintained. The dev does have it out on GitHub for the time being. I had some SSL certificate trouble trying to install the module using Python 2.7.10. Therefore I just downloaded the ZIP from GitHub and then used pip to install the module from the local repository using this command:

(Make sure you are in the root of the repo folder)
pip install -e .

Make sure you include that period on the end of the command

From there I was able to continue with the Yahoo OAuth Process.


You will need to create a project to get a API Consumer key and Consume Secret. Once you login to Yahoo Developer network you can go to the projects page: https://developer.apps.yahoo.com/projects. Here you can create a new app.

Sample Python code for Authentication


You setup a simple cache directory where your authentication token will be stored. If your token is expired the script will request another one. On the initial execution of this script you will need to allow your new application to access your yahoo account data.

When you run the script in Python you will be prompted to visit a URL. This URL will then spit out a code. You take the code and paste it back in your Python Console. This will setup a trust with your new application. You only have to do this to establish the token. Subsequent calls should work fine.

From there you start writing your YQL queries.


Now its just a matter of looping through the JSON response and grabbing the data you need. Here is a full Python Script example.


Data

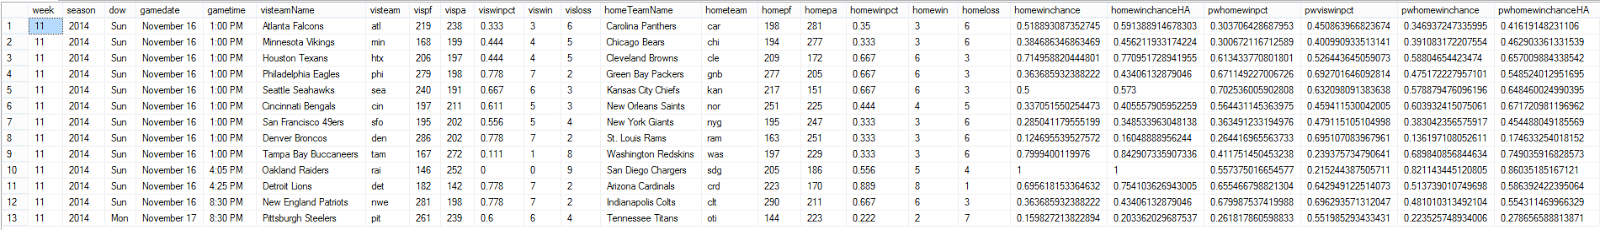
It took a while for me to figure out how to traverse the various JSON responses from the API. Once you get in there and mess around for a bit it will get a little easier. I targeted the following data sets of interest to me. There are other data sets available. You can use the YQL console to browse around and grab what you want.

Teams

Using the teams API I was able to capture all the teams in the league. The teams are given a unique team_key that will be used later when we go to find rosters and such. 
  • Team_key: unique ID for each team 
  • TeamName: name of the team given by the manager of the team
  • Division: Division ID the team belongs to.
  • Number_of_Moves: Number of player adds/drops
  • Number_of_Trades: Number of player trades
  • Manager_Nick: Nick Name of the manager in their yahoo account
  • Manager_Email: Email address of the manager
Stat Settings

The Stat Settings table is used to store information about the various scoring categories. Each stat has a unique stat_id. I used the LeagueSettings API to grab this data.

  • Stat_ID: Unique ID identifing each stat
  • Enabled: bit value indicating if the stat is enabled
  • stat_name: name of the stat (Example: Passing yards)
  • Stat_modifier: How much the stat is worth. (Example: In our league a passing yard is worth 0.05 points)
I need to figure out how to get the bonus settings. I may just hard code that since I was not having much luck grabbing that from the API.

Matchups

The matchups text file shows the result of each week's head to head matchup. I stored the Team ID to enable me to join that to the team table detailed above.


  • Week Number: Week of the matchup
  • Matchup ID: I number each matchup for SELECT purposes. There are 2 teams for every matchup ID.
  • Team ID: unique team identifier
  • Team Points: Number of points the team scored
  • Team Projected Points: Number of points the team was projected to score.
  • Team Key: Another Unique team identifier.
Roster Stats

For each team's roster stats I execute a terribly inefficent loop where I grab a team id, then hit the API using a WEEK IN (1,2,3,4,5,6,7,8,9,10,11,12,13,14,15,16,17). I grab the stats for every time for each week and dump in into the text file. There are two outputs from the rosterStats.py script.

  • Roster
    • Team ID: Unique Team Identifier
    • Fname: Player First Name
    • Lname: Player Last Name
    • Team: Player's Team name (Ex: Kansas City Chiefs)
    • Player ID: Unqiue player identifier
    • Player Key: Unqiue player Identifier
    • Week Number: Season Week Number
    • Total Points: Points scored by player based on our league settings
    • Position: Roster position
  • Roster stats
    • Player ID: Unique player identifier
    • Week Num: Season Week Number
    • Player Key: Unique Player identifier
    • Stat ID: Stat identifier (Ex: Passing Yards)
    • Stat Value: Value of the stat (Ex. 314)

Now I just have to wait until tomorrow when the season is complete. I will do one last data grab and then the real fun can start. I plan to start analyzing the data. I am especially interested in draft analysis to determine the impact of various drafted players on the season, rate how well each manager drafted, etc. I'd also like to play with various scoring scenarios to see how that effects league scoring.

Our league is unique in the fact that we have a 2QB league and the QBs are rated higher due to our 6 point per passing TD setting. In my opinion that represents the NFL better than a standard scoring league since in the NFL good QBs are vital to most successful teams.


Monday, December 8, 2014

SQL Server Calculating Distance using GPS

How far is it from Colorado Springs, CO to the Limon, CO Municipal Airport? If you just blurted out 64.53 miles than you are correct. Why should you know that? I have no clue. I do know however that on several occasions I have had a list of GPS coordinates and have thought to my self, "Self! How do I compute the distance to other points using SQL Server".

Well friends today I finally needed this functionality in some side project I was working on. The goal was to allow a user to input a location, geocode that location to find Latitude and Longitude, and then look up all the other locations in the database within 250 miles of the entered location. This is actual distance, not driving distance.

I used the Google Geocode API to do all the geocoding heavy lifting. Once I had my source GPS coordinates I searched around and found a SQL Script to take in GPS coordinates and return the distance in  meters. Added some American math to get miles and boom, my work here is finished.


I had already completed a set of Python scripts to load NOAA weather data on a daily basis. Therefore the maps hack was just an extension of the already completed website.


I added a link on the Info Window for each pin that allows you to snag the weather data for the NOAA weather station you select. You just click the Get Weather Link

You are taken back to the NOAA weather data page with past 30 days of weather data for the selected NOAA weather station.


I hope to use this functionality in some of my other current and future projects. 


Here is a video demo of the calculating the distance using SQL Server.


Monday, December 1, 2014

Energy Usage

It's time for the annual "How much power does the Christmas tree consume" game. I know you were all chomping at the bit, frantically hitting F5 on the blog here in anticipation. I typically use my Energy Calculator Google Sheet to perform the calculation, however this year I thought it would be fun to throw together a quick web site energy usage calculator (optimized for mobile of course) using the Foundation Framework we all know and have grown to love.

Without further ado, here are this year's numbers:

Findings

  • We have a total of 12 x 100 light strands for a total of 1200 lights.
  • The lights are separated into 3, 4 strand chains (kept blowing strands last year)
  • The tree is pulling a total of 225 watts
  • Total cost for 1 hour of tree operation $0.02475
  • Rough projection of tree usage: 125 hours (4 hours/day for 25 days + some fudge)
  • Grand total of $3.03 {high hat crash psshshshshshs}


There you go folks: $3.03 total cost. If you want to see how much power your various appliances are using, I recommend you pick up a Kill-A-Watt. These are great stocking stuffers for the power conscious and/or stats lover on your Christmas list.

You can use the Energy Usage site to plug in your values here: http://www.thejoestory.com/energy


Powershell Windows Mount Point Free Space

I needed a quick script to monitor the free space on a cluster server using Windows Mount points. Here is the script:


Output

Tuesday, November 25, 2014

NFL Picks of the Week (POW)

A couple weeks ago I introduced an attempt at rating the weekly NFL matchups in a metric I called WatchFactor. Nothing new or fancy, just a rating system based off the Pythagorean Wins Expectation formulas that has been done several times before. Since I had the Home Team Win Probablility calculated based off the Pythagorean Wins formula, I decided to keep track of how good the method was at predicting games.

The first week (Week 11) the POW system went 8-6. These are just a few of the outcomes from week 11.

  • Not many people outside of St. Louis saw the Rams beating the Broncos 22 - 7.
  • Saints looked terrible at home against the Bengals.
  • The Bears found a way to save themselves from 3 embarrassing wins in a row
  • The Bucs decimated the Redskins. The Redskins are awful
  • The Patriots dismantled the Colts in Prime time. 

So not a terrible week at 8-6, but not like you can quit your day job and become a full time NFL gambler either. As part of the POW projection system I setup a Python script to send out a tweet with the week's watch factor ratings. Here is the tweet for week 12


Week 12 had few games to really get excited about looking at the WatchFactor ratings for the week. How did POW stack up in Week 12...13-2. BOOM. Look out Vegas. I of course got the Chiefs/Raiers game wrong, and for the second week in a row missed the Bengals pick by picking the Texans over the Bengals. I need to stop betting against the Bengals.

You can see the Week 12 results here: http://www.thejoestory.com/winners/nfl_results.asp?week=12&season=2014

Week 13 is shaping up to be a huge week with 6 Barn Burners (according to the WatchFactor ratings) on the schedule, including two great games slated for Thanksgiving day. We'll see how the well we predict the games this week.


Monday, November 17, 2014

Starburst 2-Pack Combo Findings

Coop and I started a discussion after dinner one evening about which 2-Pack Starburst combo was the best. A debate ensued which led me to make this.


Not completely satisfied with the results I quickly created a survey and sent it out to some folks. I also thought I would be a good idea to make a web site to house future surveys. So now going forward when we have these quick little surveys, I'll send out a link to http://www.thejoestory.com/decide.

Some people responded and here are the findings.

  • Pink Pink wins by a land slide as the best 2-Pack Starburst combo.
  • Top 3 combos
    • Pink Pink - 8.67
    • Pink Red - 8.20
    • Red Red - 7.33
  • Worst combo is Yellow Yellow with an average ranking of 2.13
  • However 6.67% of the voters thought Yellow Yellow was the best.
  • My guess is the same 6.67% of the voters gave Pink Pink the Lowest rating
  • Best Combos in order
    • Pink Pink
    • Pink Red
    • Red Red
    • Pink Orange
    • Red Orange
    • Pink Yellow
    • Orange Orange
    • Red Yellow
    • Orange Yellow
    • Yellow Yellow
  • Yellow is the least desired color. Pink is strong enough to boost the Pink Yellow combo over Orange Orange. Assuming that folks that score a Pink Yellow just pitch the Yellow in the trash.


Thursday, November 13, 2014

NFL Watch Factor

I have been working on an NFL weekly pickem site for a while, thinking I would have friends login and submit weekly NFL picks. Knowing my track record with friend website participation, I decided to try something different. I stumbled on a Grantland article written by Bill Barnwell on the NFL Week 10 recap. Near the bottom of the article he starts talking about Raiders chances of going 0-16 this season. He referenced Bill James Log5 calculation and the Pythagorean Wins Expectation theory on win probabilities.

What if I created a site that would project the win probabilities of the home team based on the Log5 and Pythagorean Wins Expectation? For Log5 calculations all I need is the winning percentage of each time. For Pythagorean Wins I just need the points for and points against for each team and apply a little math.

Take 1


The site allows you to plug in the values you have and calculate the win probabilities for the home team. The cool thing about this first attempt is that it works on all major sports by just choosing the home field advantage factor for whatever sport you want.


The winners site is good for quick one off matchup projections, however I realized pretty quick that projecting multiple games was tedious. The data for the calculations is readily available on several websites so I took the logical next step.

Projecting Winners


First I wanted to project the weekly NFL games using Log5 and Pythagorean Wins. I used Python to go out and grab all the data. Sample below

Team Stats Sample

Schedule data Sample

I wrote a couple stored procs to do the projection math and came up with the following result set.

Log5 and Pythagorean Win Projects for NFL Matchups Week 11

Those last 6 columns is the good stuff. The calculated probabilities of the home team winning based on Log5 and Pythagorean Wins on both a neutral field and using home field advantage. So now all I needed was a website to show the week matchups and probabilities.


Watch Factor


Small spoiler on that last screenshot. Since I now had the win probabilities for all the week's matchups, why not create a WatchFactor metric that will predict how watchable a NFL game will be. The WatchFactor is broken up into the following categories.

CategoryLogicNotes
Barn BurnerIf Visitor Team Wins > Losses AND Home Team Wins > Losses AND the Pythagorean Wins Home Field Advantage Probability Projection is between 40% and 65%Barn Burners should show you the matchups between two teams with winning records where the win probablility for the home team in somewhere near 50%. This would indicate that the teams are pretty well matched and they are both winning teams. Should be a good game
Stink TownCase 1: If Visitor Team Wins < Losses And Home Team Wins < Losses. Case 2: If Home Team Win Probability < 30% and if the matchup is not a dumpster fireStink town games are uninteresting games. Games between 2 losing teams or games where the home team has less than a 30% chance of winning.
Dumpster FireIf home team win probablitiy is <= 20% OR home team win probablity is >= 85%.This game is projected to be a blow out. It is going to get ugly quick.
Keep an Eye on ItIf home team wins = visitor team wins and its not a barn burner or stink townThis was an attempt to show those games that could be good games base soley on the fact that the teams have similar records.
Take it Or Leave itIf the game does not fall into any other category than it’s a take it or leave itCatch all for games that don't fit in a category.


Judging the Projections


So how accurate are the Log5 and Pythagorean Win Projections at picking the winner? I added the green check mark to the teams that are projected to win using the Pythagorean Wins with Home Field Advantage probability. I wrote a final part to the main python script to update the results table with the winning team and stats about the win (winner points, loser points, etc.). Once I have some data stored up I can start showing how accurate the Log5 and Pythagorean Wins projects can be at picking the matchups.


All the NULLS will be updated when the update scripts runs Tuesday morning after the games are finished up. The pPythwinner column shows the projected winner based on the calculated win probabilities.


Twitter


Finally I thought it would be cool and trendy to post the weekly matchup numbers to Twitter with a link back to this article explaining the method to the madness. Using the Twitter Library for Python it was pretty simple.


Friday, November 7, 2014

Just Another Walk in the Park

Shortly after I changed jobs in April 2014, I started looking for a fitness center close to work so I could keep working out. With my previous gig I was working out 4-5 times a week. Knocking out a workout over lunch is perfect for me. Making time to workout at home before/after work is a little tougher.

Unfortunately the fitness club options were few and high priced between. There is an awesome high end fitness club/spa type place right next door, but it is the price of a nice cable TV package per month. As sort of a stop-gap solution I figured I could just walk around the neighborhoods near the office a few times a day and figure out what I want to do.

Westwood park is a perfect park for walking and it is located just across the street from my building. The park is situated on an entire city block, so its nice and spread out. The park has side walk walking trails, several tall trees, playground equipment, a baseball diamond, and a picnic shelter.

So one day in early July I started walking the park on my smoke breaks (I don't smoke, I just call them smoke breaks). If you have read much of my blog you could probably start to guess what is about to happen. I started thinking what if I started tracking laps in this park? I could start timing each lap, see how fast I could walk a lap, compare the laps over time, etc. It is almost like an illness. I am constantly looking for datasets in everyday activities.

I used Google maps to carve out a lap and on July 8th I tracked my first three laps. Using my trusty Timex stopwatch I tracked the lap times: 5 minutes 30 seconds, 5 minutes 34 seconds, and 5 minutes 53 seconds. I considered 5 minutes and 30 seconds the baseline. Again the first approach to this experiment was to see how fast I could power walk a lap.

In order to decide which laps will be counted in the fastest laps record book, I setup a couple rules.
Rule 1: All steps must be on the sidewalk, no walking in the grass.
Rule 2: You can only walk, no jogging.

Rule 2 was pretty subjective, I mean I was not following the official Speedwalk rule book, but basically I said no jogging, just power walking.

I had an epiphany on day 2, July 9th. After tracking 2 more Personal Best Record (PBR) laps (5:23 and 5:16), I said "Self! why am I not breaking these laps up into segments." Instead of tracking one large lap, I should break the laps up into segments to see which parts of the course I need to work on. Again using Google Maps I split the track up into four segments (s1,s2,s3,s4). This allowed me to measure my time with more granularity. Who doesn't like more granularity?

July 10th was the first run measuring the four segments. I set a new PBR of 5:08 with the following segment times:

SegmentTime
S10:00:51.4
S2 0:01:47.7
S30:01:22.8
S40:01:06.2
Total0:05:08.0


With the new segment tracking in place I was well on my way to fastest lap time greatness. After each walk I could review the segments and try to determine where I could improve comparing times to previous segments. With each lap I was walking faster and faster, pushing harder to get the time lower. At some point I knew I would reach my Terminal Walking Velocity and would not be able to shave anymore time off the route unless I ran. That day came on July 24 on Lap 3.

Lap 1 and 2 on July 24th were pretty fast laps (5:00 and 4:57). I started the final stretch of Lap 2 and was determined to power walk the entire last lap with laser beam focus and extreme vigor. After the dust settled and the shin splits subsided I realized I had made history that day my friends. This lap was the fastest Westwood Park Speed lap humanly possible by thejoestory.


SegmentTime
S10:00:43.9
S2 0:01:34.9
S30:01:15.4
S40:01:01.6
Total0:04:35.9


Sixteen days after starting I had reached Terminal Walking Velocity average 4.98 MPH on the entire lap, a 12 minute mile pace. At this point I wasn't really sure what to try next with the experiment, having reached the fastest lap. I had started tracking distance during week 2 and started to wonder. How long would it take me to get 100 miles completed on this route I had carved out? What if I tracked and recorded the data on every lap for 100 miles and then wrote an article on it? Here we are my friends.


Near the end of the July I estimated it would probably take until the end of October to finish the 100 miles. So I set courses for 100 miles and started eating laps in the park just about everyday I was in the office. I reached 100 miles on 11/6/2014 just over my projected date and it felt good to be finished with this project. With about 40 laps to go I was getting burned out on this route and I wanted to switch it up a little. However, I pressed on and logged a total of 263 laps in the park with a total distance of 100.36 miles.

Naturally my co-workers started wondering why I was walking so many laps around the park. I let them come out and get a little taste of a power walk lap with me. I had to throw these times out because they couldn't handle my power walking prowess. I threw out a total of 6 laps because their slow lap times were skewing my numbers quiet a bit.

Course Details


As mentioned the course was a walking trail in Westwood Park. Here is a quick picture tour of the course. Sorry this is a sad attempt at trying to embed a google photo album into its blogging software. Come on Google we deserve better free services than this. Geez!
2014/07/08

Segments


Here is an overhead view of the four segments.


SegmentDistance Feet
1329
2699
3547
4440
Total2,015

So each lap was 2015 feet or .38 of a mile. During each smoke break I would try to get a 3 lap set completed which took a little over 15 minutes. See table below for lap/distance calculations.


LapsDistance (mile)
10.38
20.76
31.14
41.53
51.91
62.29
72.67
83.05
93.43
103.82
114.20
124.58


Days of Week Break down


The new gig affords me the luxury of working from home some days. You can see with the lap counts that the days of choice are Fridays and Mondays. The majority of WFH days are Fridays and you can see the low lap count.


DayLap CountMiles
Monday4416.79
Tuesday6524.81
Wednesday6625.19
Thursday6123.28
Friday2710.30
Total263100.37


  • Mondays had the best overall average. I will chalk that up to being refreshed after the weekend ready to dominate some laps. The highest average for Fridays tends to support that theory. In fact you can see a day to day growth of the overall average
  • Thursday was the record breaking day with the fastest lap recorded.
  • Thursdays laps were also the most sporadic with a 10 second lap standard deviation. 


S1S2S3S4TotalS1 MPHS2 MPHS3 MPHS4 MPHLap MPHFPS
Average00:50.101:47.301:22.901:07.705:07.94.4852208844.4483534144.5032530124.4338152614.4675903616.552499796
Max00:56.601:58.001:34.801:13.905:27.25.115.024.944.894.987.310427659
Min00:43.901:34.901:15.401:01.304:35.93.964.043.934.064.216.168267747
StdDev00:01.500:03.500:02.400:02.200:08.30.1367848380.1471608810.1273843290.1466065340.1202733540.176698389
Total03:27:44.807:25:07.605:43:58.404:41:05.921:17:56.7

  • I spent a little over 21 hours completing this project.
  • S1 has a really low standard deviation of 1.5 seconds. That is equivalent to roughly 6 feet. Wild to think over 260 something laps that the first lap was that consistent.
  • Total lap times were mildly sporadic when viewing the standard deviation of 8.3 seconds. That is a swing of 30-35 feet
  • If you look at the Min time line and view the lap times on the PBR July 24th Lap 3 run you will notice that the actual Terminal Walking Velocity could be a little lower. Only July 17th the record was set for the S4 segment at 01:01.3, which is .3 fasater than the PBR S4 of 01:01.6

Calories burned


One of the intial goals of the speed walks in the park was to keep active and excercise. Using the Run Keeper app I was able to calculate the number of calories burned / lap. Run Keeper calculated I burned 60 calories/lap. That works out real convenient since standard lap set was 3 making my standard calories burned 180, which so happens to roughly equal the amount of calories in a 12 oz. can of Mt. Dew (170).


LapsDistance (mile)Calories per lap
10.3860
20.76120
31.14180
41.53240
51.91300
62.29360
72.67420
83.05480
93.43540
103.82600
114.20660
124.58720

So how many total calories did I burn in this experiment? 15,780 calories burned. Or 92.8 Mt. Dews.


ItemCalories/perCount
Big Mac55028.69090909
Chick Fil A Chicken Biscuit44035.86363636
Pepperoni Pizza31050.90322581
Donut26060.69230769
Cool Ranch Locos Taco Supreme20078.9
Mt Dew17092.82352941
Fun Size Kit Kat60263


Man I love some Cool Ranch Tacos. I should eat 78 of them, because I earned it. After creating this chart I wanted to create a web site to allow people to plug in numbers and figure out how long it would take for them to burn off the item. I have to put that on the TODO list.

I attached the heart rate monitor and tracked a few laps. Here is a 3 lap sample heart rate snapshot.


One cool thing the Heart Rate shows is that I am elevating my heart rated during the walks. Since I work in the computer biz I have to make it a point to get up and keep moving throughout the day. It would be easy for me to sit long periods of time at work with no activity. I am trying to stay as active as possible during the work day.


Raw Data


Here is the Raw Segment Data in all of its glorious splendor. Given the awesome photo library embed earlier, not sure how this google sheet document will embed but it's worth a shot.


Wrap up and Pictures


So my four month Walk in the Park data collection project comes to an end. I can honestly say I was tired of collecting data for this thing. I am ready now to explore the surrounding neighborhoods near work. Here is a list of things I saw while on the walks.


  • Countless dogs
  • Dozens of wild dogs off their leash with owner not concerned about who dog attacks
  • Dog Fight
  • People of all ages
  • Several Circle of Life moments involving birds and grasshoppers
  • More squirrels then you could shake a stick at
  • Sister crashing into her brother on a bike
  • 4 Suspicious looking delivery vehicles
  • A football game involving some annoying teenagers
  • A Chris Cakes party
  • Tired parents
  • Lost Sippie Cup
  • Lost Hoodie Sweatshirt
  • Lost Soccer ball
  • Kids trying to play baseball
  • This one couple over and over and over again, think we had the same morning walking schedule
  • Some hippies under a tree


Finally here are a few more pictures of the Terminal Velocity Speed Power Walk project of 2014.


Tuesday, November 4, 2014

Open Data Kansas City

Several metro areas are exposing more and more data to the public. Kansas City uses the service Socrata as a data portal to serve up all kinds of information about the city. If you have not explored the data available to the fine citizens of Kansas City, make your way https://data.kcmo.org/ and check it out.

Tornado Siren Location


One cool data set they recently released is the Tornado Siren Location. They are claiming 100% coverage on the metro area with the Tornado Siren System. Using the open data portal I was able to quickly dump the data to a CSV file and map it out using Google maps. Of course the data portal will make a map for you, but the option to download the data is a great feature if you are planning to use the data some other way.


What else


Perhaps you are looking for answers to these questions.

Tons and tons of interesting information available through the web site.

Saturday, November 1, 2014

2014 Halloween Haul Numbers

As mentioned in the previous post I created the Candy Tracker mobile website to track the candy received by the boys on Halloween night. I sent the link out to my friends, and as usual, it didn't exactly go viral.

I however got some good use out of it. I tried to log each piece of candy the boys received. The main hurdles to overcome where cold hands and spider man/hulk masks preventing the boys from seeing what candy they received.

SweetSpot Maps


As entries were posted to the Candy Tracker app, pins were placed on the SweetSpot Real-Time Candy Tracker map. This allowed you to see where the best candy was being doled out. Below is a review of each of the spots that were logged.

We hit a total of four places Halloween night. I did have one other person log a few pieces of candy and also pasted his maps below.

First stop of the evening was the Trunk-or-Treak over at the Liberty Clinic. As you can see it was a pretty decent score. We received 2 bags of pretzels indicated by the red pins. You'll notice the first instance of my GPS being a little off with the wild Yellow pin (sucker) off in the distance.


We did score 2 Twix, a Snickers, and a Milky Way shown by the green pins. All and all not a bad haul. Some of the trunks were decorated really cool. We also scored 3 frisbees.


Second stop of the evening was the Liberty Square. The businesses around the square hand out candy, the fireman park a fire truck and the police help direct traffic. We really like the square because you get a good amount of candy, it starts when its still daylight, and is pretty easy to guide the kids around the block. You can tell my GPS was really struggling here because all of the business are located around that center green square labeled Liberty Square. You can see the pins are all over the board.
We found some great variety here and we had only one low rated candy with a sucker rated a 3.

The third stop of the evening was another Trunk-or-Treat located a couple blocks from the square. Here we landed a dreaded Peanut Butter Chew. Other than that we made out like bandits. Good quality candy here. Oh and we also scored some pumpkin bookmarks.
Final stop of the evening was Grandma's street. Lots of yellows here in Grandma's neighborhood. It may have been that my hands were getting cold and I was getting tired of chasing the boys around. Anyway again we had some good scores mixed in with some so-so candy.


Below are a couple maps from a friend. He logged 6 pieces of candy total.


Candy Tiers


We could argue about the best candy for a long time. Most normal people would agree that Reeses Peanut Butter Cups are the best and we have the Candy Bracket to prove it. In an attempt to truly gauge the awesomeness of the 2014 Halloween Haul I split the candy into groups as follows:


  • Tier 1 - High Quality candy, the best of the best. Always chocolate. Nothing fruity makes this Tier. Strawberry Starburst is the only fruity candy that almost cracks Tier 1 barrier.
    • Examples: Twix, Snickers, Milkway
    • Surprises: Milk Duds, Reeses Pieces
       
  • Tier 2 - The second best candy. You eat this candy when all the Tier 1 candy is gone. Every once in a while you spread in a Tier 2 piece among the Tier 1 consumption. The high end fruity candy is here.
    • Examples: Skittles, Starburst, Tootsie Rolls
    • Surprises: Butterfinger (get stuck in your teeth), Sour patch Kids, 3 Muskateers (chocolate but not good enough for Tier 1)
  • Tier 3 - Starting to scrape bottom here. These are pieces you pick up and you actually try to convince yourself its a good idea to consume this candy
    • Examples: Mike and Ikes, Air heads, Nerds
    • Surprises: Dots (chewy fruit erasers), Sweet Tarts, Twizzlers (flavored plastic chews)
  • Tier 4 - Just head straight to the garbage with these. No use trying 
    • Examples: Gobstoppers, Almond Joy, PB Chews
    • Surprises: Banana Laffy Taffy, Peeps (just dont work on Halloween)
  • Bags - Items that were in bags, but not in other Tiers.
    • Examples: Pretzles, Fruit Snacks, Cheezits
    • Surprises: Cheese Balls
  • Suckers - All suckers were grouped together

    • Tootsie Roll Pops
    • Dum Dums
The good news is that we received a lot of Tier 1 candy. Most normal people bring out the good stuff for Halloween. 

Findings

  • A full 61% of all candy was in Tier 1 and 2.
  • Suckers were pretty huge this year coming in as 14% of all candy received.
  • 8.56% of the candy is going straight to the trash (Tier 4 stuff). We actually got 3 Sticks of gum.
  • Hourly averages indicate the 6PM was the best time for scoring good quality candy
    • 5PM Average Rating: 6.08
    • 6PM Average Rating: 6.8
    • 7PM Average Rating: 6.16

Candy Ratings

Here is how the candy rated over all. Milky Way scored the highest average rating. Not just because its my favorite, but because its the best. Laffy Taffy with a surprise 7 rating. I chalk this up to not knowing we landed a Banana Laffy Taffy.


ItemAvg Rating
Milky Way8.50
Snickers8.14
Twix8.13
Tootsie Roll Pop8.00
Reeses Pieces8.00
Kit Kat8.00
Crunch Bar7.40
Laffy Taffy7.00
Milk Duds7.00
Butterfinger7.00
Whoppers7.00
Skittles6.75
Tootsie Roll6.20
Starburst6.00
3 Muskateers5.75
Twizzlers5.50
Other4.83
Sucker4.78
Popcorn4.50
Dots3.00
Almond Joy2.00
PB Chews2.00
Pretzels2.00

Non-Candy Notes


We scored a few pieces of non-candy. One of the best scores was the Glow in the Dark Skeleton. The pumpkin bookmarks were a hit with the boys, as well as the Ice/Heat packs we received from The Liberty Clinic. We also scored 3 new Orange Full Size Frisbees. This is easily one of the best Non-Candy Halloween nights we've had.

Candy Counts

Total Counts are show in the table below.

222 Pieces counted overall. This does not count a "few" pieces we enjoyed celebrating the epic Halloween Haul. Still its a good gauge of how much free candy the boys brought home.

Here are the counts for each Tier.

TypeCountTier
Snickers191
Milky Way161
M & M51
Kit Kat31
Crunch Bar81
Reeses Pieces11
Twix241
Reeses PB41
Milk Duds11
Butterfinger42
Peanut M&M12
Goodbar12
Whoppers42
Sour Patch Kids22
3 Muskateers82
Starburst82
Starburst Tropical12
Laffy Taffy Straw22
Laffy Taffy Apple12
Laffy Taffy Cherry12
Skittles62
Wildberry Skittles22
Tootsie Rolls - Midgees82
Tootsie Rolls - logs42
Tootsie Rolls - Skinny Logs32
Twizzlers43
Flavored Tootsie Rolls - orange23
Flavored Tootsie Rolls - Blue13
Flavored Tootsie Rolls - Green43
Flavored Tootsie Rolls - yellow13
Mike and Ike13
Air head13
Lemon Head13
Nerds - grape23
Nerds - strawberry13
Scooby Sour Apple13
Krispie Treat23
Dots13
Sweet Tarts13
Gobstoppers44
Gum Sticks34
Peeps24
Almond Joy14
Mystery Pixie Stick24
PB Chew14
Banana Laffy Taffy14
Life Save Gummy14
Double Bubble24
Bubble Yum14
Peppermint14
Pretzles3Bags
Fruit Snacks5Bags
Cheese Balls2Bags
Cheezits2Bags
Glow in the Dark Skeleton1Non Candy
Bookmarks2Non Candy
Ice/Heat Packs2Non Candy
Frisbee3Non Candy
Mini Tootsie Roll Pop12Sucker
Tootsie Pops2Sucker
Dum Dums15Sucker
Jolly Rancher Pops2Sucker

Friday, October 31, 2014

Candy Tracker: Finding the Sweet Spots

So here is how the conversation went.
J: "team story going trick-or-treating tomorrow?" 
Me: "Roger that. We hit the liberty square hard. candy like you've never seen and then we hit grandma's street. boys don't have the stamina yet to hit the epic haul. you have a small window where you have the strength and you are not too old...like the 9-11 range" 
J: "lol im surprised you haven't mapped out the hot spots" 
Me: "thats a good idea i could build a mobile app real quick and then just rank the candy, then heat map it" 
J: "hahaha. there ya go"
Thirty minutes later the first version of Candy Tracker was up and rolling. I am using jscript to find your current GPS coordinates and using the Foundation Framework to make it look decent on mobile.

The idea is that as you walk around tricker-treating with the kids you log what candy you get and give it a simple rating. Of course the ratings will be subjective and could possibly cause fighting when discussing the best candy.

Since we have the GPS coordinates and the candy rating why not show this on a map? Version 2 of the Candy Tracker included the SweetSpot (thanks for the name PV) Real Time tracking map. I put a marker on a map and color the marker based on the rating given to the candy.


  • Green marker: Candy Rating > 7 Swoop Swoop 
  • Yellow Marker: Candy Rating Between 4 and 7 
  • Red Marker: Candy Rating less than 3, Dont't waste your time they are handing out pretzles or something.

Here is the current version. Feel free to test spin it out tonight while you are out and about. http://www.thejoestory.com/candytracker


Thursday, October 30, 2014

Twitter Status Update Python Script

Posting a status update on Twitter is very simple using Python. Here are the steps.

Youtube Demo:


  • Setup a new application for your account on http://apps.twitter.com
    • You will want to setup a read/write application
    • Give it a name and a URL
    • Twitter will give you 4 pieces of info you need
      • Consumer Key
      • Consumer Secret
      • Access Token
      • Access Token Secret
    • You can find all these tokens and secrets under the Keys and Access Tokens Tab on twitter.
  • Install the Python Twitter library using easy_setup
    • Head to a command prompt and run: easy_install.exe twitter
    • If you do no have Easy Install setup then google that and get it setup today. It makes adding modules to Python a cinch.
  • Write the script
    • Using your secret tokens and keys and your newly installed twitter module. Write a script like this. 

Tuesday, October 28, 2014

MLB Expected Outcomes

Stumbled on this article 10/23 about predicting MLB AB Outcomes and thought to my self "Self! that would make a decent web app". I wanted a quick way to compare batters and pitchers while watching the world series.

The article had a spreadsheet that allowed you to plug in numbers to the cells to get expected outcomes. Since he had the data already available why not make it where you can plug in various batter pitcher combos to see what happens.

I quickly realized this spreadsheet had some more math than I thought, but I was able to get something hammered out as a version 1 type site that did a decent job with the comparing. One glaring issue is the fact you have to search through the mega drop down box to find the players. I plan to change that in version 2 to create an auto suggest type feature...that is if I get around to it.

For now you can see the version 1 here: http://www.thejoestory.com/mlb_eo


Tuesday, October 21, 2014

NOAA Weather Data

Yeah so I'm a little weird. I get excited when someone says "Do you have access to X data set?" "Can you find data about X?" and other sorts of questions about data. When I see a new data set I have this overwhelming urge to put the data in a database and start running queries. You can shake your head here.

So yesterday when a friend asked me "How much weather data do you have access to?" I was excited. Excited enough to eat lunch at my desk and pound out a weather data load and weather search website.

I started searching for weather data and quickly landed on the NOAA web site. They have made huge strides in the past 5 years (like everyone else) to distribute data to the masses in easily consumable forms. Starting with this site: http://www.ncdc.noaa.gov/ and clicking on Data Access landed me here: http://www.ncdc.noaa.gov/data-access.

My friend wanted temperature high, low and precip amount. Using the Land-Based station section on the NOAA data access page I quickly stumbled on this: http://cdo.ncdc.noaa.gov/qclcd_ascii/

Gamechanger! CSVs. How can you not get excited about CSVs!!!!


So now all we need is a script to grab the zip file, extract the files, clean up the CSV a bit, load the data, and build a web front end to expose the data.

Python Script Extract and Load


Database

I just needed a couple tables and a few stored procedures to expose the data to the web site. <disclaimer soap box>I understand this code will not scale well. I did not want to spend a lot of time modifying the data. Remember this was on my lunch break. Most of the stuff I write is throw-away code or is only used by a handful of people. This is good because I typically do not have to worry about scale, and bad because I am not learning the  techniques of writing code that scales.</disclaimer soap box>


Web Site


Now that we have the data we can build a quick UI using the Foundation Framework. You need to know the weather conditions at Big Bear City Airport in California from 8/15/2014 to 9/21/2014, no fret I got the deets. Holding weather conditions down over here. What What.

Sorry for that last sentence. I was trying to make weather conditions sound hip to the millennial crowd.

Anyway another dataset consumed, another victory lap taken, another celebatory Mt. Dew opened. Its a great time for consumers of data to be alive.